|
Deicing Facility Precipitation Frequency Analysis
|   |
|
Deicing Facility Precipitation Frequency Analysis
| |
Two methods have been used within NetSTORM to determine precipitation frequencies for airport deicing facility designs. The simpler approach requires only censoring the full dataset for a station to include only those months when deicing is likely to occur. The second method involves censoring the dataset to remove precipitation on dates when the minimum temperature exceeds a threshold below which deicing is unlikely to have occurred using a utility built into the program.
Figure 2 shows precipitation depths at durations from one to 24 hours for a 10% annual probability, commonly referred to as a 10-year storm for Cleveland Hopkins Airport. Curves are shown for data censored to remove dates where the minimum temperature exceeded 2.8° C (37° F), for all precipitation from November to April, for the complete record, and for Ohio Region 3 from the Rainfall Frequency Atlas of the Midwest (Huff and Angel, 1992). The atlas data are shown for reference purposes; the difference between the complete record analysis using NetSTORM and the atlas may be due to station skew relative to the regional record. Analyses of other cities using NetSTORM usually show much closer correspondence with current atlases. The graph shows that precipitation intensity on cold days is less than one-third of the complete record at a 1-hour duration, and two-thirds of the complete record at longer durations. Even when the analysis is more conservatively limited to the complete cold-weather season, the precipitation depths range from 50% to 80% of those computed for a year-round analysis. These results demonstrate the value of basing storage and treatment facility sizing on design precipitation depths to avoid overestimation of runoff depths associated with seasonal storm events.
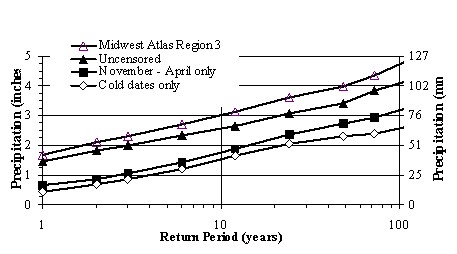
Figure 2. Winter IDF Analysis, Cleveland Ohio.